
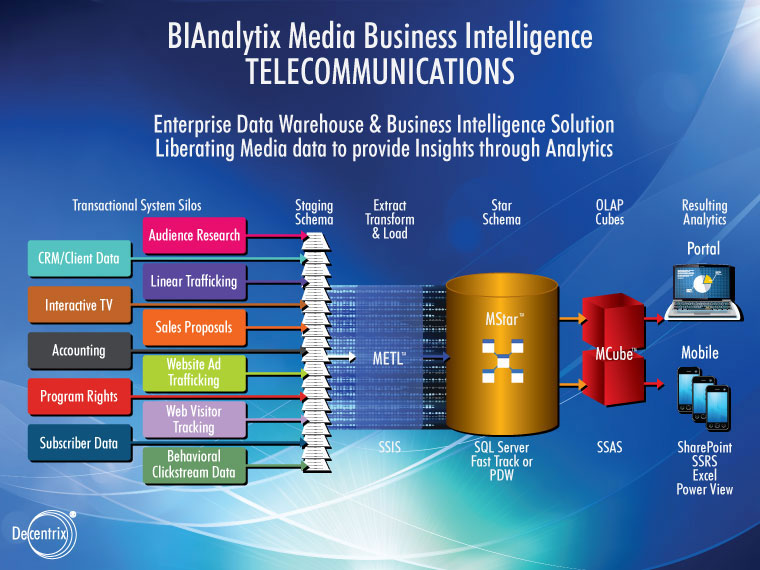
Telecommunication Corporations have historically been based on voice services but have moved into deploying broadband services initially over old copper and the past couple of decades over newer fiber backbones. With broadband services largely deployed they have expanding into VOIP and IPTV distribution and their programming services are largely identical to Cable MSOs. Subscription based programming offerings are now extensive but little effort has been focused on advertising opportunities at the present time. Transactional systems employed span settop box delivery, subscriber data, quality of service data, Settop box and clickstream data, interactive TV, PPV, VOD , web and accounting.
Below are some examples of the exclusive BIAnalytix Modules that streamline the process of gathering and analyzing this critical transactional data. BIAnalytix is the key to better business decisions and business insights that result in higher profits and a competitive advantage.
Telecommunications Solution Modules
BIAnalytix Website Ad Revenue Module
This Module supports the revenue associated with website banner ads by loading the campaign details, the insertion statistics, and the website visitor information to the data warehouse.
The report capabilities are grouped into the following families:
- Web Campaign Delivery Analysis - This analysis family provides rich analysis of the campaign impressions and click-thrus. The campaign revenue incurred together with the delivery statistics allows the cost per impression and cost per click-thru to be reported. The campaign data is summarized by the agency, the advertiser, the copy viewed. An example of the power of the analysis is to compare the effectiveness (click-thru percentage) of the different campaign copy items. These copy identifiers can be related to copy on the broadcast channels. Further analysis can be provided if the demographic of the site visitor can be discerned. This is normally through the techniques of free subscription services such as news or weather e-mail services.
- Multi-media campaign Analysis - When the Web campaign details are consolidated in the data warehouse with the broadcast campaign details, the combined advertiser campaign analysis can be provided. Mapping of the agencies and advertisers between the web and broadcast data provides full multi-media campaigns integrating total revenue across both media. Effectiveness measures can be used to weight web and broadcast impressions and cost per impression to further compare integrated campaigns. In particular, with the same copy ID used on the web and broadcast for video, then effectiveness (click-thru percentage) from the web data can be used to refine the broadcast copy campaign.
- Traffic Delivery Audit Analysis - With the Web traffic system results, the impressions available on website page groups can be totaled. The impressions from the site log can be compared to ensure the alignment of the impressions from the two different sources.
- Site Visitor Flow Analysis - With the page visit statistics, the visitor flow from and to pages can be analyzed to relate source and destination page flows to web ad effectiveness. This can be used to tune site links to improve effectiveness for the advertiser. The statistics can be presented in both page impressions as well as visitor time spent.
- Promotional Effectiveness - If the broadcast traffic system includes promotion spots, then the promotion spots that promote the media web pages can be selected. This can then relate the changes in web page traffic to the promotion effort and expense on the broadcast channels.
- Site Retention Analysis - The page flow statistics from the first visitor page can highlight the site departure statistics to assist the site design focused on improving the retention of visitors. The number of impressions possible (capacity) on a web site is directly related to the time spent within the web site.
- Site Capacity Analysis - With the page visitor statistics, then the capacity of the site for impressions can be monitored and trended. Comparisons with past periods can track the improvements of capacity and thus campaign revenue potential of the site.
BIAnalytix Targeted Analysis Module
Targeted Campaigns are defined as having specifications of the viewer's attributes that filter the play out of the ad. These attributes could be geographic (state, zip, DMA...) or subscriber based (credit rating, age group...) or behavioral (baseball fans, travel enthusiasts...).
The BIAnalytix Targeted Analysis Module provides analysis over the targeted ad viewing records from the set top box or the mobile viewer device logs. The analysis uses the copy ID of the material played at each device to relate the event to its campaign. Also the device ID is used to bring the viewer or subscriber attributes into the analysis but the ID is hidden to prevent any analysis from identifying the viewer.
The primary analysis goal is to accumulate the actual delivery impressions that did occur for each campaign and to enable analysis by the viewer attributes.
BIAnalytix Viewer Activity Module
The BIAnalytix™ Viewer Activity Module is designed to process the viewer channel change transactions. It converts the channel change transactions into viewing events suitable for analysis to quarter hour or program totals.
The system provides a full range of viewing metrics. Also the system is capable of deriving the audience books suitable for the Campaign Performance Module. This Module requires a large database server to hold the high volume of such viewer transactions for analysis.
BIAnalytix Subscriber Base Analysis Module
This Subscriber Analysis Module covers all the activity transactions of the connection and disconnect of subscribers to Packages. It is used for detailed analysis at any date of the number of subscribers moving to/from every unique type of product.
This BIAnalytix Module supports both historical comparisons and forecasts, and it also focuses on the daily/weekly/monthly changes in the products on subscriber accounts. The primary use is to provide bottom line numbers for subs, revenue, discounts, sell-in, & churn without all of the noise present in order & job detail. The report capabilities are grouped into the following families.
- Subscriber Analysis - This family focuses on the daily/weekly/monthly changes in the products on subscriber accounts. Both historical and forecasts are supported. The primary use is to provide bottom line numbers for subs, revenue, discounts, sell-in and churn without all the noise present in order and job detail.
- Sales/Order Analysis - This report family looks at overall sales activity from a sales manager's perspective and includes order detail to understand who is selling what to whom and at what offer level.
- Equipment Analysis - This family of analysis can be used to identify how equipment is migrating through the system, including missing, trapped or under-utilized equipment.
- Job Analysis - This family of analysis provides details of the work being done to fulfill customer requests including connects, discounts, trouble calls and special request orders.